
TrackExplorer
Explore, track, remember, and understand your adventures
Explore, track, remember, and understand your adventures
Find out about the beautiful core capabilities of the app. Learn how it helps you explore, track, remember, and understand your adventures.

The center of it all
This is where you find your tracks, view them, get their most important information, organize them, and the starting point for the more advanced functionality.
More:
Search, filter and sort with custom views; view performance data totals and averages, add tracks to collections.


Different ways to display your tracks in the home page
Customize the size of the images, the data fields that are displayed, and how the tracks are color coded. Save the perfect settings with each view.
From left: large images with no data; small images with default data, color-coded by location; medium images with minimal data.
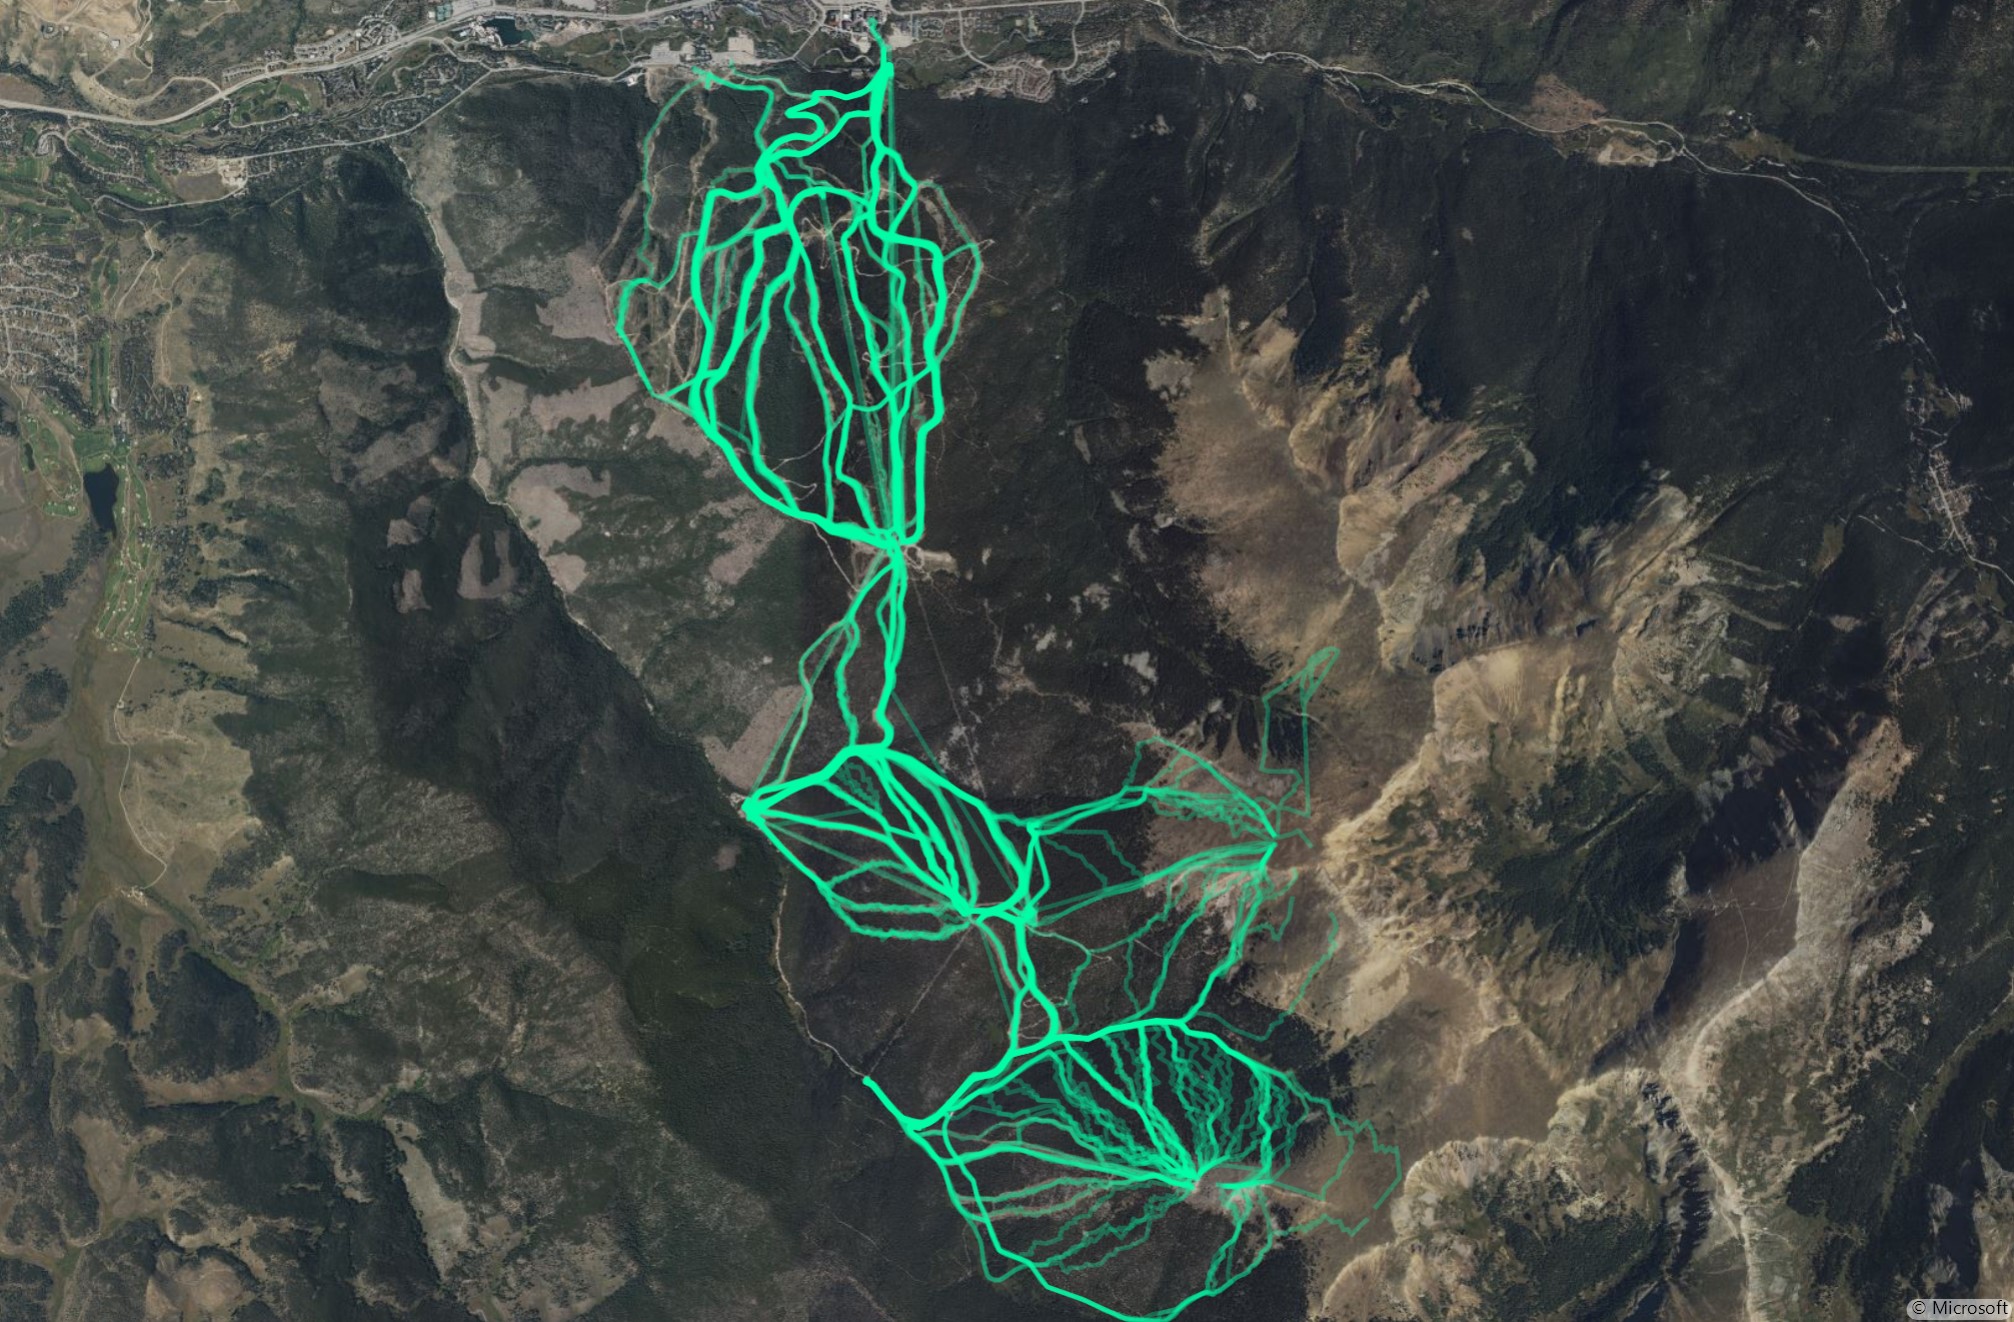
A heat map of ski trips to Keystone, Colorado
Skiing tracks overlaid on the Bing Aerial map. Each track is semi-transparent, and the color becomes more intense in the more skied paths. The ski lift sections have been removed using the GPX editor functionality, leaving a cleaner visualization.


Your options
Select the best map type to highlight your track; color or label the tracks by any of several fields; zoom in and out, and pan in any direction; set the thickness and opacity of the track; decide the stacking order of the tracks, if they are in the same places; display time and distance markers; highlight the latest track, and more.
Examples
Top image: Stadia Outdoors map, showing multiple skiing tracks, color-coded by ski season. The legend on the right identifies the seasons by color.
Second image: Thunderforest Landscape map, showing the track and the location of photos taken along it. One of the photos has been selected and is open, overlaying the map. The tools menu is hidden, to leave space for the map.
Third image: Esri world topo map, showing two tracks, each with its own color. The more recent track is above the other (this can be inverted). The legend on the right identifies the tracks by color.
Fourth image: OpenStreetMap map, showing multiple mountain biking tracks. The tracks are colored by total distance, and the legend on the right shows how the colors relate to distances. Each track is labeled with the track name.
Last image: Thunderforest Landscape map, showing a single track and markers that identify the 2 hours and 25 miles points. The markers can be positions using the sliders on the right.

Bring together tracks that are from the same trip, or that otherwise have something in common.
Add or remove tracks easily, and easily find the related tracks to display them together on the map, or compare their profiles, compare their data, or more.
Create automatically two types of web pages
A page for a single track, or a page for multiple tracks. Then, publish the pages to your Netlify account, or save them on your computer to publish in other ways. Note that this functionality is still in beta status.
Single track page
Select a track, decide if you want to include: map, elevation profile, details, links; and if you want to provide the GPX file for download.
See the screenshot on the left, or open directly the single track page example
Multiple tracks page
Select multiple tracks, choose a name and description, decide if you want to include map and elevation profile.
See the screenshot on the right, or open directly the multiple track page example


Display the elevation profiles of one or more tracks in the same chart
Select the values for the X axis (distance or time) and for the Y axis (elevation, cumulative elevation gain, distance or time); select the scale of the Y axis (starting from 0, from the lowest point, or normalizing all tracks based on their starting point); set the colors, backgrouns, gridlines as you like.
Examples
On the left, eight hikes are shown based on their actual elevation, with the scale starting at 0. This shows the tracks exactly where they are in elevation in reality: Mount Evans 2018 is at the top. Note the legend at the top associating each track to a color.
In the middle, the scale has been changed to relative - the starting points of all hikes are at the same level. This highlights the elevation gains: Pizzo Porcellizzo towers over the others.
On the right, the plotted value is not the elevation, but the cumulative elevation gain. This highlights the tracks with the most sustained elevation gain: Cupid & Grizzly becomes more noticeable now.

You have tracks that you want to hike, backcountry ski, or bike and you want to guess how long it will take.
The planner page offers a few algorithms to help you do just that - you can provide the parameters yourself, or estimate them on the basis of similar activities you did in the past.
Example
In the screenshot, we imported tracks for a few alternative options for our goal to climb Father Dyer's Peak. We ran a couple of algorithms but the results are not yet convincing - we have more work to do.


From top left:

View the history of your activity - select the measure for the Y axis (ascent, count, descent, distance, Laps/runs, or time); select the time horizon for the X axis (day, week, month season, or year); select one of several fields to color the bars, and choose your preferred aesthetic options.
Example
Hours of skiing by month, color coded by location.

Open all selected tracks in a grid and compare all their performance data.

Create views to quickly filter and sort the tracks you see in the home page.
Filter by any of the track-related data, perform advanced logical operations, and set default options to use when navigating to the home, map, profiles, and history pages.
Organize views in folder, and access them directly from the home page.


Working with views
Left: expand the views tree stracture and navigate it to find the view you want to use.
Middle: create a quick view using a single-parameter text or numeric search - in the example, we are looking for all tracks with a distance greater than 15
Right: with special views, immediately find all tracks that share commonalities with the selected one, such as same location, gear, people, and more.